
When searching for the best place to buy a home in Adelaide, one of the most important things I wanted to know was: what are Adelaide’s safest and least safe suburbs?
Based on South Australia Police crime statistics from July 2018 to March 2019, the top 10 safest suburbs in Adelaide are Mount Osmond, Erindale, Glenalta, Roselyn Park, Upper Sturt, McLaren Flat, Stonyfell, Craigburn Farm, Auldana and Teningie.
Based on the same data, the top 10 least safe suburbs are Lonsdale, Mile End South, Cavan, Parafield, Noarlunga Centre, Bolivar, Outer Harbor, Elizabeth, Dry Creek and Lightsview.
How did I come up with this data, you ask?
South Australia Police release annual crime figures, however the Excel spreadsheet in which these statistics are buried is lengthy, tedious and virtually impossible to use to compare suburbs, as it lodges each individual offence from every single Adelaide area in its own in individual row.
So, we’re talking over 70,000 offences – yikes.
For ease of reading, I spent many hours combing through the data and compiling a list of the total offences reported in each Adelaide suburb.
I then went through and found the total population for these suburbs, and divided that figure by the number of offences to determine the number of crimes committed per person in each area.
Because the population varies from suburb to suburb, the ‘crimes per person’ figure gives the most accurate representation of how many offences have been carried out across each Adelaide postcode.
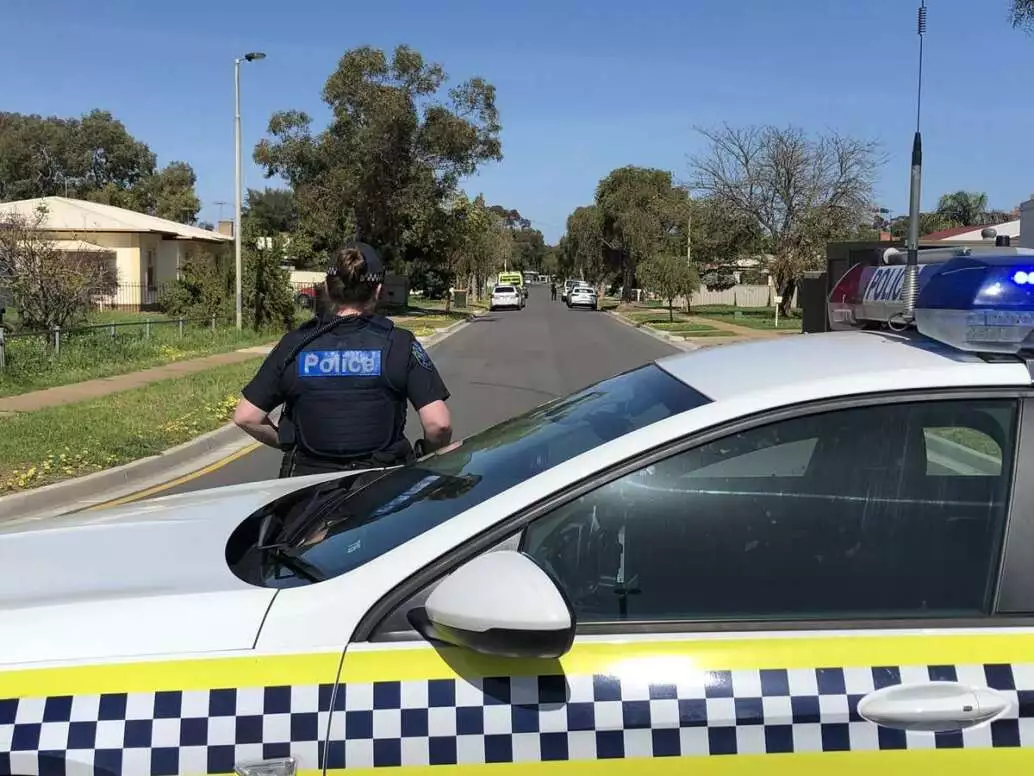
The results of this were somewhat surprising, particularly when looking at the least safe suburbs, according to the data.
While the common stereotype is that Adelaide’s worst crime suburbs are located north of the CBD, the statistics dispel that myth somewhat.

Of the top 10 suburbs with the highest ‘crime per person’ ratio, three were situated south of the city, one was located west, with the remainder found in the north.
Similarly, many of the safest suburbs in Adelaide were found to the east of the city centre, towards the Adelaide Hills and away from the more metropolitan areas.
Check out the top 10 safest and least safe suburbs in Adelaide list below.
You can also scroll to the bottom of the article to see the full table list of Adelaide crime statistics.
Top 10 safest suburbs in Adelaide
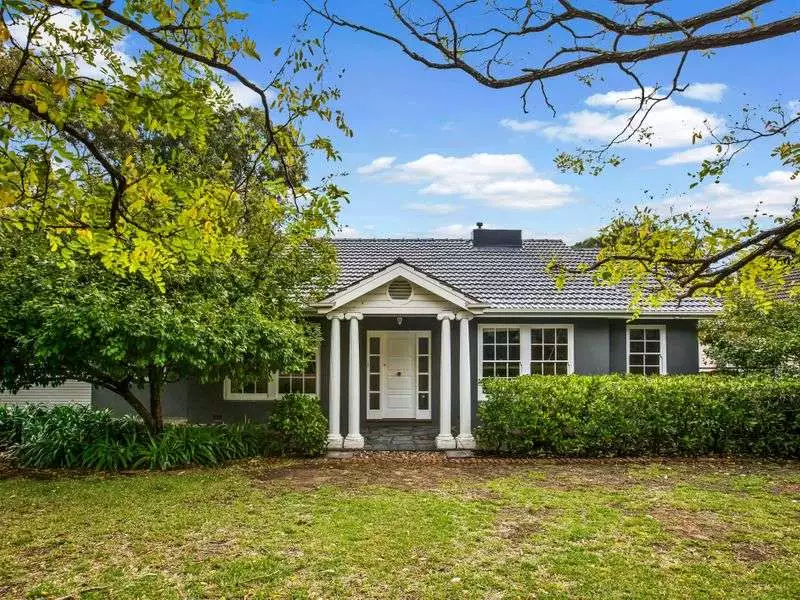
1. Mount Osmond
Number of offences: 3
Population: 2375
Crimes per person: 0.001
2. Erindale
Number of offences: 7
Population: 1886
Crimes per person: 0.004
3. Glenalta
Number of offences: 12
Population: 1959
Crimes per person: 0.0061
4. Roselyn Park
Number of offences: 9
Population: 1460
Crimes per person: 0.0062
5. Upper Sturt
Number of offences: 6
Population: 951
Crimes per person: 0.0063
6. McLaren Flat
Number of offences: 10
Population: 1537
Crimes per person: 0.0065
7. Stonyfell
Number of offences: 9
Population: 1326
Crimes per person: 0.0068

8. Craigburn Farm
Number of offences: 18
Population: 2394
Crimes per person: 0.0075
9. Auldana
Number of offences: 5
Population: 625
Crimes per person: 0.008
10. Teringie
Number of offences: 7
Population: 820
Crimes per person: 0.0085
Top 10 least safe suburbs in Adelaide
1. Lonsdale
Number of offences: 145
Population: 29
Crimes per person: 5
2. Mile End South
Number of offences: 92
Population: 24
Crimes per person: 3.83
3. Cavan
Number of offences: 141
Population: 40
Crimes per person: 3.52
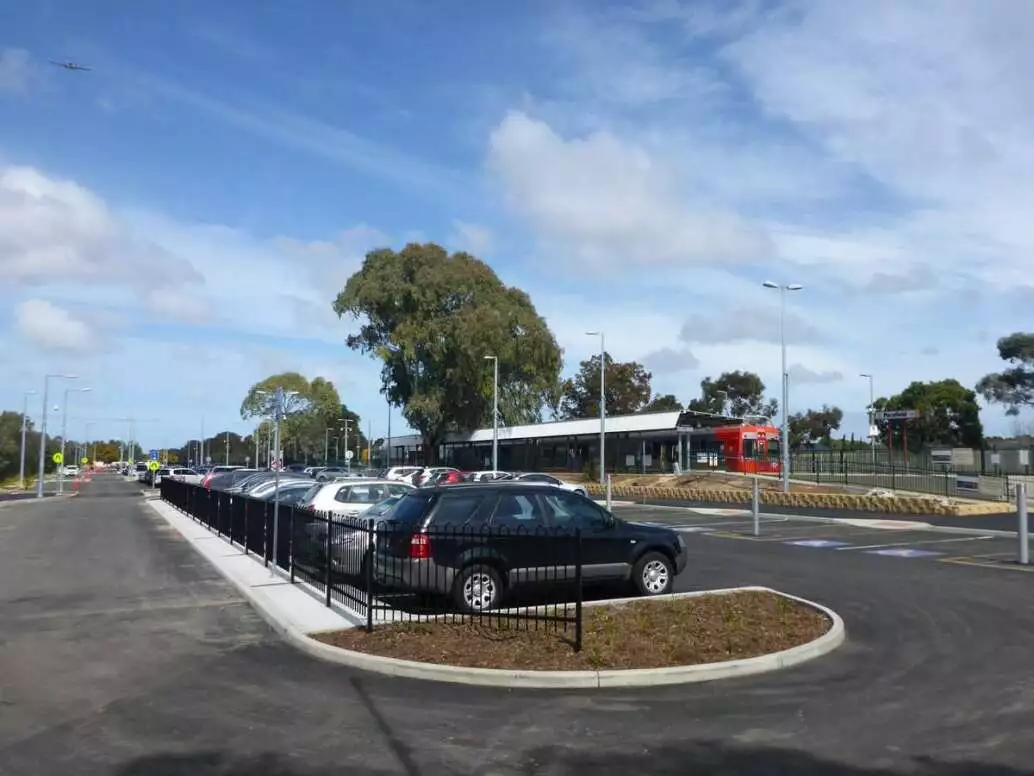
4. Parafield
Number of offences: 357
Population: 105
Crimes per person: 3.4
5. Noarlunga Centre
Number of offences: 539
Population: 203
Crimes per person: 2.65
6. Bolivar
Number of offences: 256
Population: 269
Crimes per person: 0.952
7. Outer Harbor
Number of offences: 10
Population: 12
Crimes per person: 0.83
8. Elizabeth
Number of offences: 841
Population: 1024
Crimes per person: 0.82
9. Dry Creek
Number of offences: 151
Population: 228
Crimes per person: 0.66
10. Lightsview
Number of offences: 211
Population: 327
Crimes per person: 0.64